A good information system must be able to extract data and deliver strategic insight to the people who make the most important decisions in a company, the so-called "decision-makers": finance directors, sales and production managers, and managing directors.
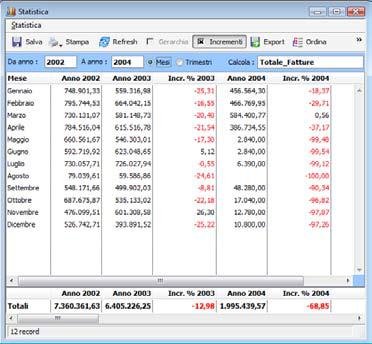
Horizon provides a universal, powerful and intuitive system for producing complex statistics, pivot tables, comparative analysis and summaries in both numerical and graphical form, using multidimensional charts built into the platform, bar charts, pie charts and much more for state-of-the-art analysis.
Decision support features
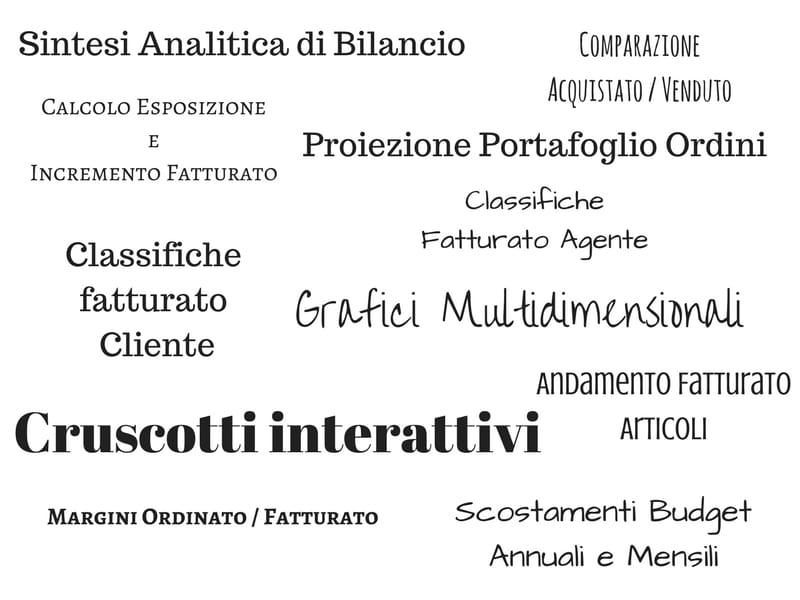
- Purchased vs sold comparison
- Analytical financial statement summary
- Contribution margins
- Order book projection
- Exposure and turnover growth calculation
- Turnover rankings by sales agent
- Turnover rankings by customer
- Multidimensional charts
- Turnover trends by item
- Annual and monthly budget variances
- Interactive dashboards
- Ordered vs invoiced margins
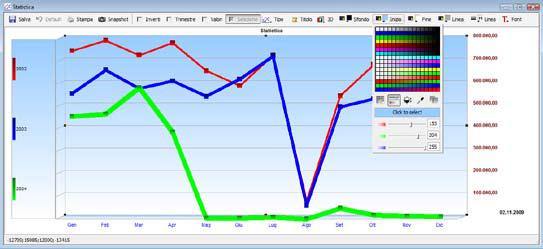
With Horizon you can chart any type of statistic, including over time, for example:
√√ Ordered, Delivered and Invoiced by Item, Product Category, Production Line
√√ Ordered, Delivered and Invoiced by Customer, Supplier, Sales Agent, Carrier
√√ Ordered, Delivered and Invoiced by Year, Quarter, Month, Season
√√ Ordered, Delivered and Purchased by Supplier, with Margins and Average Prices
Every report can also be shown as a pivot table with percentage change against the previous value. This makes it effortless to compare monthly growth across different years, or to track the performance of best-selling items or key customers over the years.